Trade forex and crypto based on support and resistance levels
You’ve researched and are ready to start trading the price chart. But wait, before you start moving ahead, there are some important things to consider. Support and resistance levels, for instance, are the foundational elements of successful forex and crypto trading.
But what exactly does this mean? How do you use support and resistance in your trades? And how do you know when to jump in (or out) of trades? In this article, I'll take all the mystery out of support and resistance levels - and show you how they can help lead to your trading success. In combination with other elements, you will become profitable.
What Is Support and Resistance in Forex or Crypto Trading?
Are you familiar with Support and Resistance in basic trading? As a new trader, these concepts are essential to understand. In brief, Support and Resistance are repeating price points on a trading chart where the price is expected to stop either rising in an uptrend or falling in a downtrend. You can predict future price action if you find these repeating reversal points. Predicting future price action means better entries and exits.
Good Charting takes advantage of the power of strong Support Resistance levels. Support indicates the price level at which an asset's decline in price reverses, while Resistance refers to the price where an asset's upward price movement reverses. Drawing horizontal Support and Resistance lines can help traders have a clearer perspective of where these reversals may happen. This greater predictive power means more accurate trades. More accurate trades translate into more profit.
Utilizing Technical Analysis in Crypto and Forex Trading
Utilizing Technical Analysis is one part of trading Forex and Crypto. In technical analysis, support and resistance levels are the fundamental properties plotted by chartists. It's the first thing I plot on a chart. I used them in confluence with other chart properties to help me know when to enter or exit a trade.
A support or resistance area is mostly identified using horizontal lines or zones but can also include trendlines, moving averages, and Fibonacci retracements. We are looking for more than one of these to line up to give us higher probability entries.
The Different Types of Crypto and Forex Support and Resistance
Again, begin with plotting support and resistance in trading crypto or forex. Resistance and support refer to the horizontal lines on a chart where the price may or likely stop and reverse, preventing a higher or lower price.
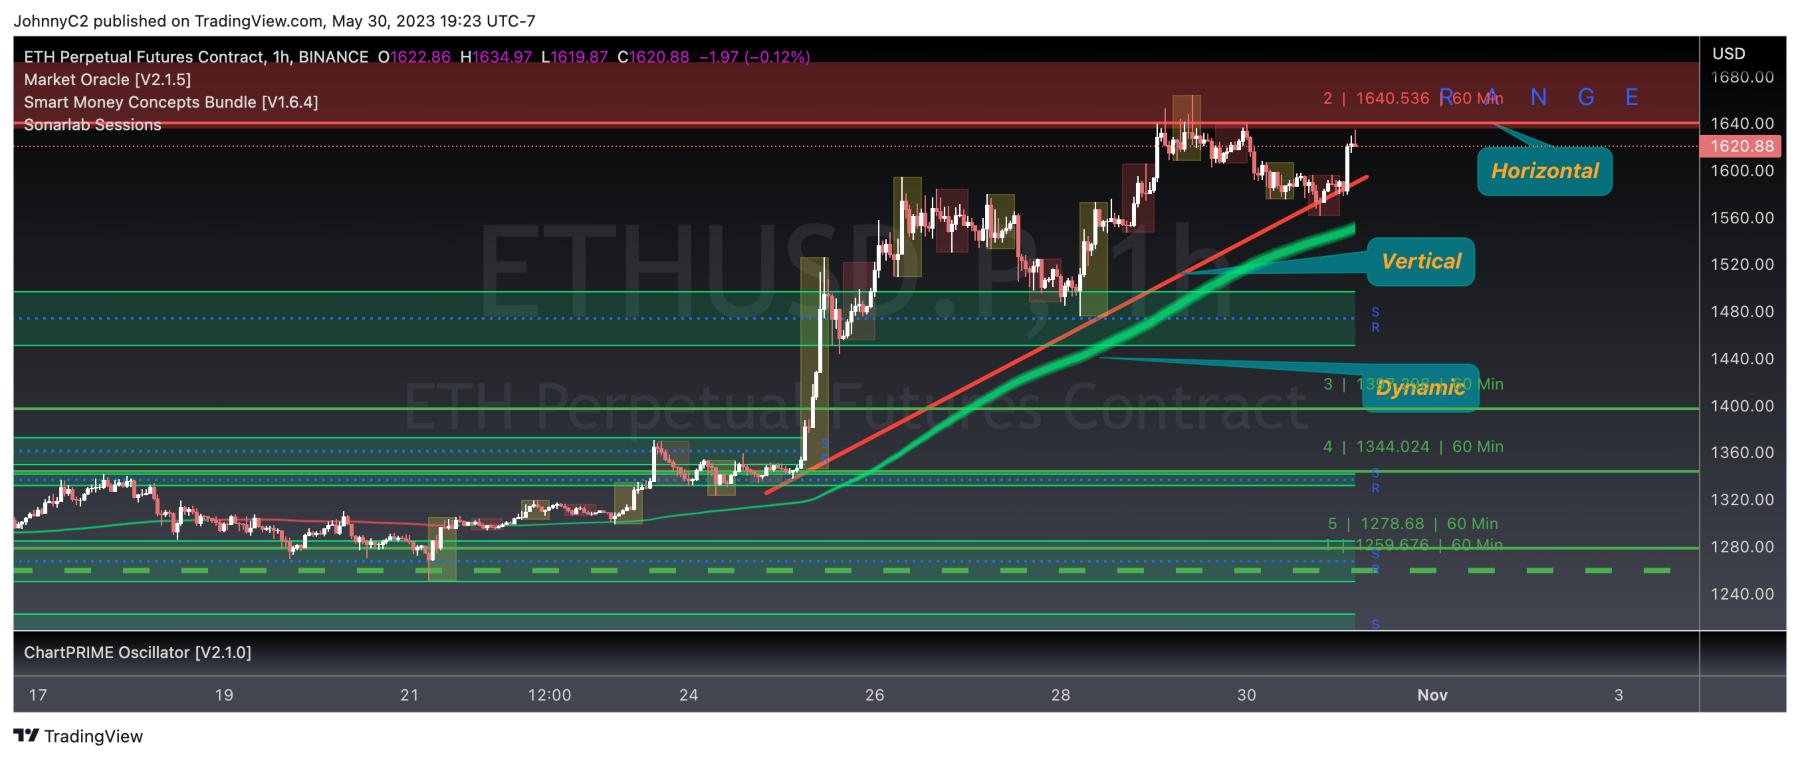
There are three types of support and resistance: moving averages, horizontal, and diagonal trendlines. Moving averages use recent price data to plot a curve that future prices may react to. Horizontal levels are determined by previous highs(resistance) and lows (support). In contrast, diagonal lines of support or resistance are indicated by higher highs and higher lows or lower highs and lower lows as prices move in a slanted line across the chart.
Other popular forms of support and resistance that I include in my trading strategies include Fibonacci Expansion/Projection. Research and test these techniques in demo accounts before using them on real trades! Again combine several to find high-probability entries that give you confidence as a trader. Greater confidence means more wins.
Check out the following support and resistance levels using the Chartprime indicators:

Setting Up Your Charts for Support & Resistance Trading
For successful trade setups using resistance and support levels, consider including—supply, demand, and round numbers. These chart properties all indicate where buyers and sellers may enter the market. If they occur in the same spot on a chart, they indicate a place for the price to return to. This is called confluence. Confluence means higher probability trades and better trading.
Identifying Support and Resistance Area Trading Opportunities
When trading forex or crypto, traders must plot major support or resistance levels. Minor support and resistance levels, where the price has only returned a couple of times, should be ignored.
Traders can combine a variety of different approaches. Horizontal lines are drawn on a chart to indicate where an asset's price has reversed and offer hints of future areas of reversal. Another useful technique is utilizing trendlines or Fibonacci lines to find possible reversal points. With all these levels determined, I search for locations where all methods meet to find a good entry or exit. Consistently doing this breeds consistent profits.
An indicator that automatically plots support and resistance levels speeds up the process. The trading indicator suite Chartprime does an excellent job at this while including some of the confluence I mentioned. Chartprime allows for a long or short trade based on several indicators, including one that allows you to find support and resistance levels of different time frames
Find Support and Resistance in the Form of Round Numbers
Round numbers act as a form of support and resistance levels in forex and crypto. Round numbers are prices such as 1.0000 or 1.0050 which end with "00" or "50". Of the two "00" is the stronger. They are very often the price points institutional traders buy and sell at. This is due to the fact that an institution's trading method with larger sums of money often involves entry points that are easiest to work with, hence the tried and true method of round numbers acting as areas of support and resistance.
FAQs on Trading Using Support and Resistance Levels
Q. What are Support and Resistance Levels?
A. Support and resistance levels are areas where the price is obstructed and prevented from moving further. Previous support or resistance represents areas where buyers or sellers were willing to buy or sell, but they can also signal an area where the price could reverse if the price breaks through. Support and resistance levels can be drawn as wider zones or sometimes thinner lines.
Q. What Strategies Can I Use to Trade Based on them?
A. In trading there are common approaches to utilize support and resistance levels effectively. These include buying currency pairs when they're near support in uptrends taking advantage of breakout trades and recognizing patterns like triangles, wedges, double tops and head & shoulders. The trading algorithm called Chart Prime is particularly proficient in this area as it automatically provides traders, with marked support and resistance zones.
Q. How Do I Identify Support and Resistance Levels?
A. When it comes to identifying support and resistance levels we examine price data, previous instances of support and resistance as well as technical indicators, like moving averages Fibonacci retracements and pivot points. It's worth noting that the more a level is tested the stronger it becomes over time.
Q. Does support and resistance work?
A. Support and resistance levels continue to be important, in Forex trading. It is crucial for traders to understand their use for trading. However it's important to remember that these levels alone may not guarantee long-term success. Traders should incorporate support and resistance levels into a strategy that takes into account market sentiment, fundamentals and risk management techniques. When used effectively support and resistance levels can greatly contribute to achieving success, in the Forex markets.
Q. Do professional traders use support and resistance?
A. Experienced forex traders rely on support and resistance strategies to predict the movements of their currency pairs. By utilizing analysis and examining past data these skilled traders can form an understanding of future price changes. Identifying support and resistance levels provides them with valuable insight, into market sentiment, enabling them to make well informed trading decisions.
Q. Which time frame is best for support and resistance?
A. When it comes to trading the ideal time frame for support and resistance, usually the higher time frames are the most accurate. What timeframe you chose depends on what you're comfortable with. For those who trade intraday, focusing on shorter time frames, like 5 minute, higher times frames such as the 15-minute or 1-hour charts can help spot trends and add more accuracy. Those with a longer time approach may find it more effective to analyze 4-hour or daily charts to observe price movements over an extended period. Again, generally speaking, support and resistance zones tend to be more accurate when analyzed using 4-hour time frames or above.
Q. How can traders distinguish the most important support and resistance levels?
A. The support and resistance levels that hold significance are the ones that are clearly visible and distinct. It is crucial to have no doubts, about whether certain peaks and troughs indicate support and resistance. If there is any uncertainty in determining these levels it is advisable to refrain from making a trade. The reliable support and resistance levels are easily identifiable often associated with price reversals and tend to occur on longer time frames like the 4 hour and daily charts. Trading algorithms, like Chart Prime automatically plot these levels for convenience.
Q. What is Forex Market Sentiment?
A. Understanding market sentiment is importance in the ever changing global foreign exchange market. It refers to the viewpoint and emotions of all participants, which have an influence on currency prices. By assessing investors overall sentiment and outlook traders can gain understanding of present and future price fluctuations enabling them to make informed trading choices. Grasping market sentiment is beneficial, for both novice and experienced traders striving for profitability in the fiercely competitive forex market.
Q. What is the opposite of support and resistance?
A. Liquidity areas represent the opposite of support and resistance levels. These are regions where the price swiftly drops or rises without encountering many if any orders.
Conclusion
Understanding and leveraging support and resistance levels plays a role for traders dedicated to advancing their trading skills and increasing their profitability.
Continue to research the concepts related to trading support and resistance. Implement risk management tools like stop losses and risk to reward to protect and grow your capital. By adopting the right mindset, journaling and reviewing your trades, you can achieve consistency and therefore, profitability.