

Navigating the volatile seas of forex trading requires precision, strategy, and the right tools. As a trader, you understand the importance of leveraging advanced tools like the Chartprime TradingView Indicator to harness the full potential of support and resistance levels. This comprehensive guide is designed to help traders like you integrate ChartPrime Plus into your daily trading routine and provide support and resistance levels. By tapping into a robust collection of indicators and strategies, you can make informed trading decisions that align with your financial goals and enhance your market dynamics pro approach.
Understanding Chartprime Tradingview Indicator: The Basics
Introduction to ChartPrime Indicator
The ChartPrime TradingView Indicator stands out as a pivotal tool for both Forex and Stock traders. Used in the TradingView platform, it leverages a sophisticated algorithm to deliver clear buy and sell signals. This indicator from ChartPrime is designed to help traders identify opportune market moments by analyzing multiple signals simultaneously. By doing so, it not only predicts future price movements but also highlights potential reversal zones, allowing for more informed trading decisions.
How ChartPrime Works
At its core, the ChartPrime indicator synthesizes data from various technical elements, such as support and resistance levels, moving averages, and order blocks. When these components align, the indicator emits a buy or sell signal, providing a comprehensive view of market dynamics. This aggregation of technical data points provides traders with robust insights into market structure, facilitating strategic entry and exit points. This feature is particularly beneficial in volatile markets, where trend reversals and breakouts occur frequently.
Benefits for Traders
Enhanced Market Analysis: With features such as prime oscillators and volume analysis, traders can dissect bullish and bearish volume trends, providing deeper insights into market volatility.
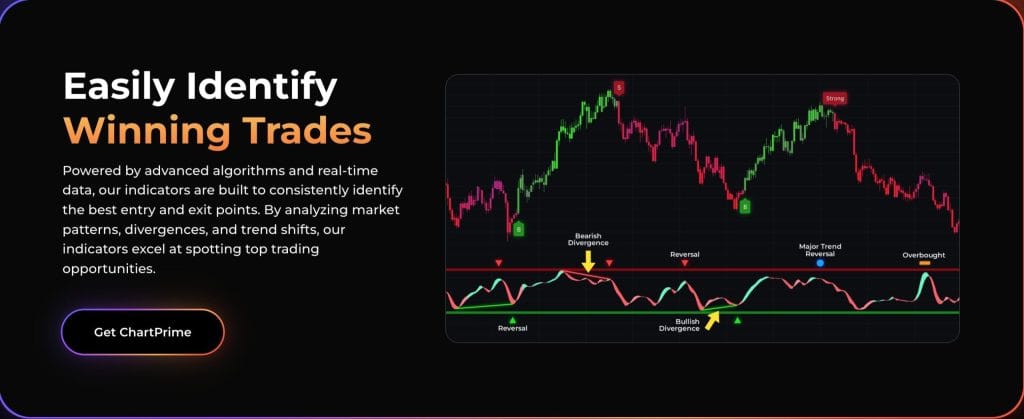
Strategic Trading Decisions: The indicator helps identify liquidity zones and dynamic support and resistance levels, which are key to crafting effective trading strategies.
Additional Features: The chartprime plus version offers premium features, including customizable alerts and advanced chart patterns, enhancing trading opportunities for seasoned professionals.
By integrating the ChartPrime on Tradingview, traders can significantly enhance their technical analysis capabilities, making ChartPrime indicators an invaluable asset in today’s fast-paced
trading environment.
Smart Money and Support and Resistance: Key Concepts in Chartprime
Understanding the Smart Money Range Indicator
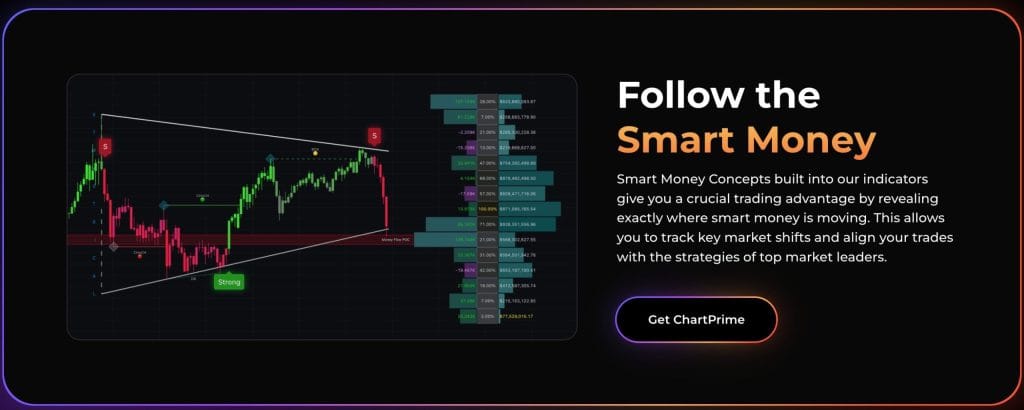
The Smart Money Range Indicator is one of the pivotal tools within the Chartprime suite. It emphasizes the importance of understanding the market structure through the lens of support and resistance. This indicator provides traders with valuable insights into how institutional investors—often termed “smart money”—are likely to influence price movements. By highlighting these critical zones, this tool allows traders to anticipate potential reversals and breakouts with greater accuracy. When combined with a keen eye for volume analysis, the Smart Money Range Indicator becomes an indispensable asset for devising effective trading strategies.
Visualizing Key Zones with Support and Resistance Power Channel
The Support and Resistance Power Channel in Chartprime serves as a visual guide, helping traders identify key zones of buying and selling power. This tool is essential for mapping support and resistance levels, the areas where price action tends to halt or reverse. By marking these critical points on your tradingview chart, it aids in making informed trading decisions. The channel helps identify dynamic support and resistance, outlining the broader market trend and preparing traders for potential shifts.
Identifying Levels with ChartPrime’s Support and Resistance Indicator
ChartPrime’s Support and Resistance Indicator takes a systematic approach to identifying support and resistance levels using pivot points and volume analysis. This indicator not only underscores where key
support and resistance levels are likely situated but also forecasts potential price movements. By integrating this tool, traders can enhance their trading strategies by spotting entry and exit points more effectively. With its ability to adapt to varying timeframes, the Support and Resistance Indicator is a crucial component for both novice and experienced traders aiming to navigate market dynamics.
How to Utilize Chartprime Plus for Identifying Bullish and Bearish Trends
Understanding ChartPrime Plus Features
ChartPrime Plus is an innovative tool that empowers traders to use sophisticated volume analysis to discern bullish and bearish trends. It utilizes smoothed volume analysis, focusing on the delta between bullish and bearish volumes. This feature plays a pivotal role in identifying potential trend shifts by examining volume disparities, thereby enhancing trading strategies.
The Role of the Prime Oscillator+
The Prime Oscillator+ is another critical component of ChartPrime Plus, offering an early indication of potential trend reversals. By meticulously analyzing bullish and bearish volumes, traders can gain foresight into emerging market trends. This oscillator acts as a sentinel, alerting traders to imminent potential trend changes, thereby facilitating more informed trading decisions.
Practical Application in Trading Strategies
Incorporating ChartPrime Plus into your trading arsenal allows for a nuanced understanding of market dynamics. By leveraging the insights from smoothed volume analysis and the Prime Oscillator+, traders can:
- Identify entry and exit points with greater precision.
- Detect potential reversal signals more swiftly
- Enhance their ability to differentiate bullish and bearish volume trends, providing a clearer picture of market structure.
By integrating these insights into your trading practices, you can refine your approach to support and resistance levels and liquidity zones, thereby capitalizing on emerging trading opportunities. Through ChartPrime Plus, traders gain a robust framework for adapting to the broader market landscape, enhancing their ability to navigate complex market conditions with confidence.
Indicators and Strategies: Enhancing Your Tradingview Experience
Exploring the Depths of TradingView Indicators
TradingView is a robust platform renowned for its comprehensive set of built-in indicators and strategies. With over 100,000 publications offering insights beyond ordinary market analysis, it provides an unparalleled arsenal for both novice and veteran traders alike. Among the most popular are the Moving Averages, RSI, Stochastic Oscillator, and Bollinger Bands. These tools are essential for performing in-depth technical analysis, allowing traders to decipher complex market dynamics.
- Moving Averages: These smooth price data, creating a single line that makes it easier to identify trend direction or potential trend reversals. It serves as a foundational element in many trading strategies, helping pinpoint entry and exit points.
- RSI (Relative Strength Index): This oscillator measures the speed and change of price movements, indicating overbought or oversold conditions which may hint at potential reversals.
- Stochastic Oscillator: Another momentum indicator, the Stochastic Oscillator compares a closing price to its price range over a specific period, providing potential buy and sell signals.
- Bollinger Bands: These are used to capture volatility and identify potential breakouts. They consist of three lines: a simple moving average in the middle and two standard-deviation lines that adapt to market volatility.
Optimizing Your TradingView Experience
By integrating these indicators with the Chartprime TradingView Indicator and embracing Chartprime Plus features, traders can significantly enhance their trading decisions. This powerful combination helps identify support and resistance levels, which are crucial for understanding price action within the broader market context. Whether you’re navigating a bullish or bearish landscape, these tools equip you with the data you need to make well-informed choices in both Forex and Crypto trading environments.
Leveraging Chartprime for Informed Trading Decisions and Support and Resistance Power
Understanding Support and Resistance with Chartprime
The ChartPrime TradingView Indicator is a powerful tool that helps traders by automatically visualizing key support and resistance zones on their charts. By plotting these crucial levels, the indicator provides a clear view of where price action might stall or reverse. This visualization is pivotal for making informed trading decisions, as identifying these zones can highlight potential buy or sell signals within the market. The ability to see these zones clearly allows traders to anticipate price movements more accurately and positions them to capitalize on trading opportunities.
Enhancing Trading Strategies with Automatic Plotting
One of the standout features of Chartprime is its capability to automatically plot support and resistance levels. This automatic plotting saves traders time and enhances their trading strategies by providing real-time data that can be quickly integrated into decision-making. Whether you’re a novice or an experienced trader, the indicator’s insights can significantly help you recognize potential trend reversals or breakouts. By highlighting these key levels, Chartprime empowers traders to adapt to market dynamics with greater agility.
Visualizing Buy and Sell Power Through Indicators
Adding another layer of analysis, the Chartprime indicator highlights the buying and selling power within the support and resistance zones. Understanding this dynamic allows traders to gauge the prevailing bullish and bearish sentiment in the market. Such insights are invaluable for deciphering potential reversals and confirming trading signals. By incorporating this data into your technical analysis, you can refine your entry and exit points and trade with more confidence.
In summary, Chartprime is an essential tool for traders looking to elevate their market analysis with precise visualizations of support and resistance.
Conclusion
In conclusion, mastering the Chartprime Tradingview Indicator can elevate your trading strategies to new heights. By integrating the comprehensive features of Chartprime Plus, you can effectively navigate the intricate waters of forex and crypto trading. Whether you are analyzing support and resistance levels, pinpointing entry and exit points, or identifying potential trend reversals, these tools empower you to make informed trading decisions. Embrace the
power of Chartprime and Tradingview to refine your approach, capitalize on market dynamics, and enhance your understanding of liquidity zones. As a trader, leveraging these insights will position you for success in the dynamic trading world.