

As a forex trader, I always seek indicators that can provide accurate buy and sell signals to improve my technical analysis. Over the years, I’ve tested countless indicators. In this article, I want to share some of the top forex indicators that have proven helpful in generating trading opportunities and maximizing profits.
Whether you’re a novice trader just getting started or a seasoned pro, these indicators are some of the best tools for identifying trends, spotting reversals, and timing your entries and exits.
Using multiple indicators together, you can develop a comprehensive trading strategy and gain an edge in the forex market. Let’s look at each forex indicator that every trader should know.
Key Takeaways
- Technical indicators are mathematical calculations based on a market’s price, volume, and open interest. They help traders analyze the market and make trading decisions.
- The most popular forex indicators are moving averages, Bollinger bands, relative strength index (RSI), stochastic oscillator and moving average convergence divergence (MACD). These indicators measure market trends, reversals, price volatility, momentum, and the strength or weakness of a market.
- No single indicator is perfect and should not be solely relied upon. Successful traders use multiple indicators and price action analysis to identify high-probability entry and exit points.
- Indicators work best when used according to the type of trade – whether you’re a day trader, swing trader or position trader. Some indicators are better suited for certain trading styles and timeframes.
- Backtest indicators before using them to see how they would have performed in the past. This helps determine the optimal settings and best pairing with other indicators. But remember that past performance is not indicative of future results.
- Always use stop losses to limit risk. No indicator is 100% accurate, so have an exit strategy if the trade goes against you.
- Stay updated with new indicators and try them in a demo account to see if they match your trading strategy. Some modern indicators like the Ichimoku cloud or Alligator indicator could enhance your trading decisions.
- In the end, the best indicator is the price itself. No tool substitutes experience, practice and a solid trading plan. Indicators should only be used to confirm what the price action is signalling.
Introduction to Forex Indicators
Technical indicators are an essential part of a forex trader’s trading strategy. They help identify opportunities, trends, reversals, and entry and exit points. I rely on several indicators to make informed trading decisions.

Bollinger Bands
Bollinger Bands measures market volatility and shows overbought/oversold levels. They consist of an upper band, lower band and moving average. The market may be overbought when the price touches the upper band, indicating a potential reversal.
When the market hits the lower band, it could be oversold, signalling a possible upward trend. For the best results, use Bollinger Bands with a period of 20 and deviations of 2.
Moving Averages
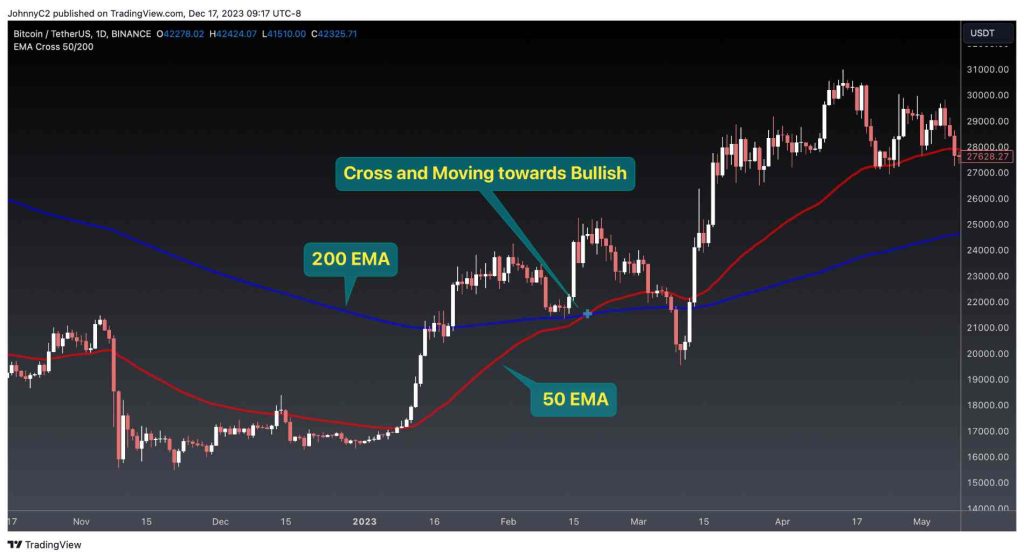
Moving averages smooth out price fluctuations to show the current trend direction. I use the 50 and 200-period exponential moving averages (EMA).
- When the 50 EMA crosses over 200 EMA, it indicates an uptrend.
- When the 50 EMA crosses below the 200 EMA, it signals a downtrend.
- Moving averages work best in trending markets.
Stochastic Oscillator
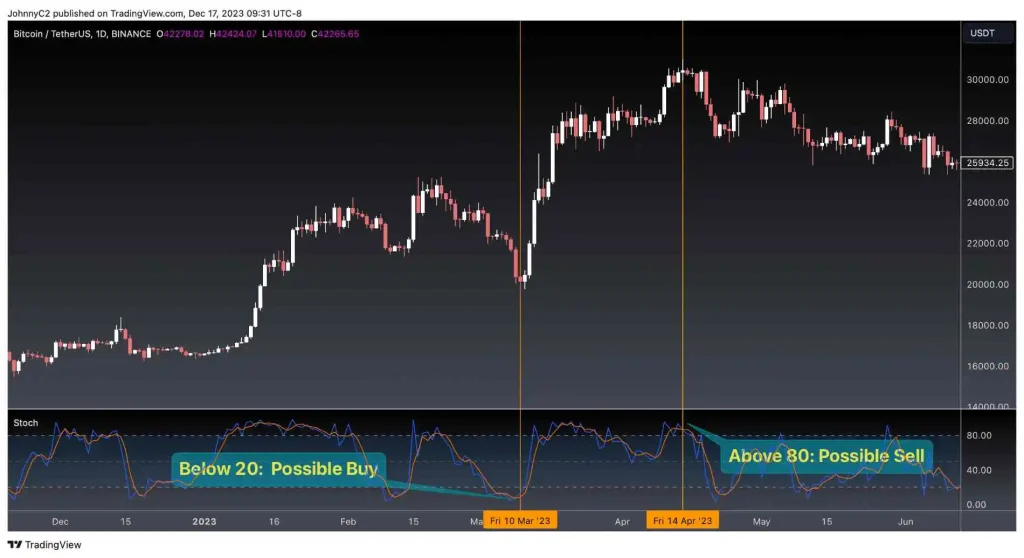
The Stochastic Oscillator measures the close relative to the high-low range over a period of time. It helps identify overbought and oversold levels.
- Readings above 80 indicate an overbought market
- Below 20 signals an oversold market.
- I look for crossovers of the %K and %D lines for buy/sell signals. For example, when %K crosses above %D, it’s a buy signal.
Other valuable indicators include the Relative Strength Index (RSI), Average True Range (ATR), and MACD. The key is finding indicators that complement each other and fit your trading style and objectives. Technical indicators can become an essential part of your trading strategy with practice.
Top Technical Indicators for Forex Trading
As a forex trader, technical indicators help determine the best times to buy and sell currency pairs. Here are three of my favourite indicators:
Bollinger Bands
Bollinger Bands measure volatility and provide entry and exit signals. They consist of three bands – an upper band, a middle band (simple moving average) and a lower band.
- The bands widen during volatile markets and contract during less volatile periods.
- When the price touches the upper band, it could indicate an overbought market and signal a potential reversal or pullback.
- If the price touches the lower band, it may indicate an oversold market and potential bounce.
- Crossing the middle band could also signal a breakout or potential trend reversal.
I like to use Bollinger Bands on the daily and 4-hour timeframes to time my entries.
Relative Strength Index (RSI)
The RSI is a momentum oscillator that measures the speed and change of price movements. It fluctuates between 0 to 100.
- Readings below 30 indicate an oversold market.
- Readings above 70 indicate an overbought market.
Divergences between the RSI and price can also signal potential reversals. For example, if the price makes a higher high but the RSI makes a lower high, it could indicate the uptrend is weakening, and a reversal may happen soon.
I use the RSI on the 1-hour and 4-hour timeframes to determine overbought and oversold levels and spot divergences.
Moving Average Convergence Divergence (MACD)
The MACD is a trend-following momentum indicator that shows the relationship between two moving averages of a currency pair. It consists of the MACD line, signal line, and MACD histogram.
Crossovers of the MACD and signal lines indicate potential trend changes or reversals. A crossover to the upside signals a bullish change in trend, while a crossover to the downside signals a bearish change.
The MACD histogram represents the distance between the MACD and the signal line. The widening of the histogram signals increases momentum, while narrowing signals decrease momentum.
I use the MACD primarily on the daily and 4-hour timeframes to determine the overall trend and spot potential reversals.
Combining these indicators can help confirm buy and sell signals and improve your trading decisions. However, no indicator is 100% accurate, so always use proper risk management. With enough practice and experience, you can determine which indicators work best for your trading style.
Using Moving Averages to Identify Trends
As a forex trader, one of the most valuable tools in my arsenal is the moving average indicator. Moving averages help identify market trends so I know whether to buy or sell a currency pair. There are a few moving averages, but two of the most popular are the simple moving average (SMA) and the exponential moving average (EMA).
The SMA calculates the average price of a currency pair over a specific period, like the last 20 days. It gives equal weight to all prices during that period. The EMA also shows the average price over time, but it offers more weight to the most recent prices. This means the EMA reacts faster to the latest price changes.
The EMA can also identify support and resistance levels. If the price approaches an EMA during an upward trend, that EMA often acts as support. The price will bounce off that EMA and continue higher. In a downward trend, the EMA can act as resistance, where the price approaches the EMA but heads lower again.
The EMA, when used on higher timeframes like the daily or weekly charts, is one of the best indicators for new forex traders. It identifies the trend and potential reversal points.
However, no indicator is perfect, so I always use the EMA and price action analysis to confirm buy and sell signals before entering a trade. The EMA gives me an edge, but multiple factors are required to make an informed trading decision.
Using the EMA and other moving averages and a solid trading plan helps take the guesswork out of forex trading. I know when the odds are in my favour to place a trade and when it’s better to stand aside.
While trading still involves risk, moving averages are a simple tool for better understanding the trend. With the right knowledge and strategy, moving averages can help any forex trader become profitable.
Bollinger Bands for Volatility and Overbought/Oversold Levels
One of my favourite indicators is the Bollinger Bands. This tool provides a lot of helpful information in one glance. The Bollinger Bands indicator uses a mathematical formula based on the volatility and standard deviation of price to plot three bands on your chart:
- An upper band that shows the maximum price volatility
- A middle band that shows the average price
- A lower band that shows the minimum price volatility
These bands expand and contract based on volatility. When the bands widen, volatility is high, and when they narrow, volatility is low.
As a trader, the Bollinger Bands tell me two essential things:
Overbought and Oversold Levels
When the price moves outside the upper or lower bands, the market may be overbought or oversold, which can indicate a reversal is coming. For example, if the price breaks above the upper band, I watch for a reversal pattern to form before the trend starts heading down again. I use the lower band in the same way for oversold reversals.
Volatility and Momentum
The widening and narrowing of the bands show me the current volatility and momentum. If the bands start to widen, the volatility increases, which often happens right before a big move. When the bands narrow, the volatility decreases, and the price may continue ranging or consolidating.
The Bollinger Bands are a helpful indicator for any trader in their toolbox. For me, they provide a quick and visual way to gauge volatility, spot potential reversals, and see momentum shifts in the market. You can always have this indicator on your charts!
Combined with other tools like moving averages or pivot points, the Bollinger Bands can generate accurate buy and sell signals to trade on.
MACD for Momentum and Trend Changes
The MACD indicator is one of my favourite tools for determining momentum changes and trend reversals in the market. As a forex trader, using the MACD helps me identify the right time to buy or sell a currency pair.
The MACD stands for Moving Average Convergence Divergence. It shows the relationship between two moving averages of prices. The MACD line is the difference between a 12-period and 26-period exponential moving average. The signal line is a 9-period moving average of the MACD line.
When the MACD line crosses above the signal line, it gives a buy signal, indicating that the trend is accelerating to the upside.
When the MACD line crosses below the signal line, it gives a sell signal as it indicates that the trend is accelerating to the downside.
Divergence
One of the most valuable signals generated by the MACD is divergence. This is when the price of an asset moves in one direction, but the MACD moves in the opposite direction.
This is when the price of an asset moves in one direction, but the MACD moves in the opposite direction.
For example, if the price is making higher highs, but the MACD is making lower highs, the momentum is weakening, and a reversal could be imminent. I watch for bearish divergence when looking for opportunities to sell and bullish divergence when looking for opportunities to buy.
The MACD indicator works on all timeframes, from the 1-minute to monthly charts.
- As a day trader, I use the MACD on the 5-minute and 15-minute charts to identify short-term momentum changes and look for trading opportunities.
- For swing trading, the 4-hour and daily charts are very useful.
No indicator is perfect, but the MACD is a very effective tool.
I use it with support, resistance levels, candlestick patterns, and trend lines to identify high-probability trading setups. The MACD helps give me an edge in the market and find trading opportunities with a good risk/reward ratio.
RSI to Gage Overbought and Oversold Conditions
The Relative Strength Index, or RSI, is one of my favourite indicators for determining overbought and oversold market conditions. As a momentum oscillator, it compares the magnitude of recent price changes to determine whether the market is overbought or oversold.
The RSI ranges from 0 to 100. An RSI of 70 or above typically indicates that a market is overbought or overvalued and may be primed for a trend reversal or corrective pullback in price. An RSI of 30 or below indicates an oversold or undervalued condition and may indicate a market poised to rally.
I use the RSI on all timeframes, from the 1-minute chart up to the weekly and monthly charts. Overbought and oversold levels are often exceeded in shorter time frames, such as the 1-minute to 5-minute charts. However, when the RSI reaches extreme levels, it usually signifies a market ready to reverse and revert to more normalized price levels.
On longer timeframes like the daily, weekly and monthly charts, reaching overbought or oversold territory carries more weight. It often signals that a significant reversal or consolidation may be on the horizon. For example, suppose the daily RSI on the market reaches 75 or above after an extended rally. That is usually a pretty reliable signal that a pullback will likely unfold over the coming days or weeks.
The RSI is a valuable tool, but I never use it alone. I always combine the RSI with price action analysis and other indicators to confirm signals.
The RSI can remain in overbought or oversold territory for extended periods while a trend remains strong, so you always need to consider the context of the broader market trend when using this indicator.
The RSI is best used to anticipate reversals and spot trading opportunities when the trend is unclear, or the market is range-bound.
If used properly, the RSI can be invaluable for determining when markets may be topping or bottoming out. But as with any indicator, it should only be used to confirm signals, not generate them. The price action is always the final judge. The RSI helps provide more context to understand what the price action may sign at any given time.
Stochastic Oscillator for Overbought/Oversold and Divergences
The stochastic oscillator is one of my favourite indicators for identifying overbought and oversold conditions and divergences that can signal trend reversals. Developed by George Lane in the 1950s, it compares the closing price of a currency pair to its price range over a given time period.
The stochastic oscillator has two lines:
- %K – The main line. It calculates the closing price as a percentage of the total price range for a given look-back period. A value over 80 means the market is overbought, while under 20 is oversold.
- %D – The signal line. It’s a moving average of %K. Crossovers of %K and %D can generate buy and sell signals.
I like to use the stochastic oscillator on short-term time frames, like 5 or 15 minutes, to identify temporary overbought or oversold conditions. When the market is overbought (>80), I watch for the %K line to cross below %D, signalling prices may reverse lower. When the market is oversold (<20), I watch for %K to cross above %D, signaling prices may bounce higher.
The stochastic oscillator also helps spot divergences – when the price is making a higher high but the oscillator is making a lower high. This can signal a trend reversal is coming. I’ve found these divergences most useful on longer time frames, like 1 hour or 4 hours.
No indicator is perfect, so I use the stochastic oscillator with other tools like support/resistance levels, trend lines, and price action. I also keep a close eye on the overall trend and market sentiment. The stochastic provides clues – you still need to determine the correct entry and exit points that match your trading style and risk tolerance.
While the stochastic oscillator may initially seem complicated, it’s pretty simple. You’ll spot overbought/oversold levels and divergences with some practice. Remember – as with any indicator, don’t rely on it alone. Use it as confirmation to make the best trading decisions for your needs. The key is finding what works for you!
Ichimoku Cloud for Trend Direction and Support/Resistance
The Ichimoku Cloud indicator is one of my favourite tools for determining the trend direction and finding support and resistance levels. As a forex trader, knowing the trend and significant S/R levels is crucial to timing your entries and exits.
The Ichimoku Cloud, also known as the “Ichimoku Kinko Hyo,” is a collection of indicators that provide an instant view of support and resistance, momentum and trend direction. At first glance, the Ichimoku chart can seem complicated, with many lines and colours. But in reality, it’s a very visual and intuitive tool once you understand how to read it.
The main components of the Ichimoku Cloud are:
- Conversion Line (Tenkan-sen): The midline represents the average of the high and low over the last nine periods. It shows the current price momentum and the first potential support/resistance level.
- Base Line (Kijun-sen): The slower moving average, calculated based on the highest high and lowest low over the past 26 periods. It indicates the overall trend direction and provides support/resistance.
- Leading Span A (Senkou Span A): Formed by adding the Conversion Line and Base Line. It is the first cloud boundary and the faster-moving support/resistance level.
- Leading Span B (Senkou Span B): Formed by averaging the highest high and lowest low over the past 52 periods. It is the second, slower cloud boundary.
- The Cloud (Kumo): The space between the two cloud boundaries (Leading Span A and Leading Span B). It highlights the overall trend and support/resistance areas.
- Lagging Span: The closing price plotted 26 periods behind. It can provide additional support/resistance and confirm trend changes.
The key is looking at how price interacts with the different Ichimoku elements. For example, if price is above the cloud, it indicates an uptrend. If the price penetrates the cloud, it signals a trend change. The thicker the cloud, the stronger the support/resistance.
The Ichimoku Cloud provides a “big picture” view of the market that helps determine the overall trend, momentum, support, and resistance. Combined with price action, it gives me accurate buy and sell signals to trade any forex pair successfully. Give the Ichimoku Cloud a try—it may become an indispensable part of your trading strategy.
Developing a Trading Plan With Forex Indicators
As a forex trader, a solid trading plan is critical to success. Technical indicators play an essential role in developing an effective strategy. They provide clues about where the market is likely headed so I can make informed trading decisions.
Some of the indicators I’ve found most useful are moving averages, Bollinger Bands, and the Relative Strength Index (RSI). Moving averages show the average price over time and help determine the trend direction. Bollinger Bands measure volatility and provide overbought/oversold signals. The RSI measures the strength of recent price changes to determine if a currency pair is overbought or oversold.
When these indicators align, it often signals an opportunity.
For example, if the 50-day and 200-day moving averages sloping upward, the market uptrends.
If the price is at the lower Bollinger Band and the RSI is below 30, the pair is likely oversold, signalling a buying opportunity. I will then look for an entry point to go long.
Conversely, if the moving averages are trending down, the price hits the upper Bollinger Band, and the RSI is above 70, the pair is likely overbought. This indicates a potential reversal and opportunity to short-sell. However, no single indicator is foolproof, so I always consider the overall context of the market before entering a trade.
Developing a trading plan with indicators has been invaluable for me. They provide an objective way to determine market direction, spot opportunities, set entry and exit points, and manage risk.
However, indicators are tools – your trading plan and risk management approach ultimately determine your success. The key is finding the right indicators and techniques that match your trading style and experience.
With practice and persistence, developing a trading plan with indicators can help you make smart trading decisions and navigate the forex market.
Conclusion
That covers some of the most popular forex indicators traders use to identify opportunities and place profitable trades. As you can see, many tools are available, but the key is finding a combination that matches your trading style and risk appetite.
Experience lets you discover which indicators work best for the currency pairs and time frames you prefer to trade. The exciting thing about forex trading is that there’s always more to learn – but remember, no indicator is perfect, and there’s no “holy grail.”
So do your research, start with a demo account, and never risk more than you can afford to lose. The profits are out there; you must find the right indicators and strategies to help guide your trading decisions.