Trading in the financial markets can be tricky, and if you're new to trading and you're going to have any chance of success, you'll need some tools in your arsenal. One of the essential tools is an excellent moving average indicator. A moving average (MA) indicator is a technical analysis tool that helps smooth out price data by calculating the average price over a specified number of price bars.
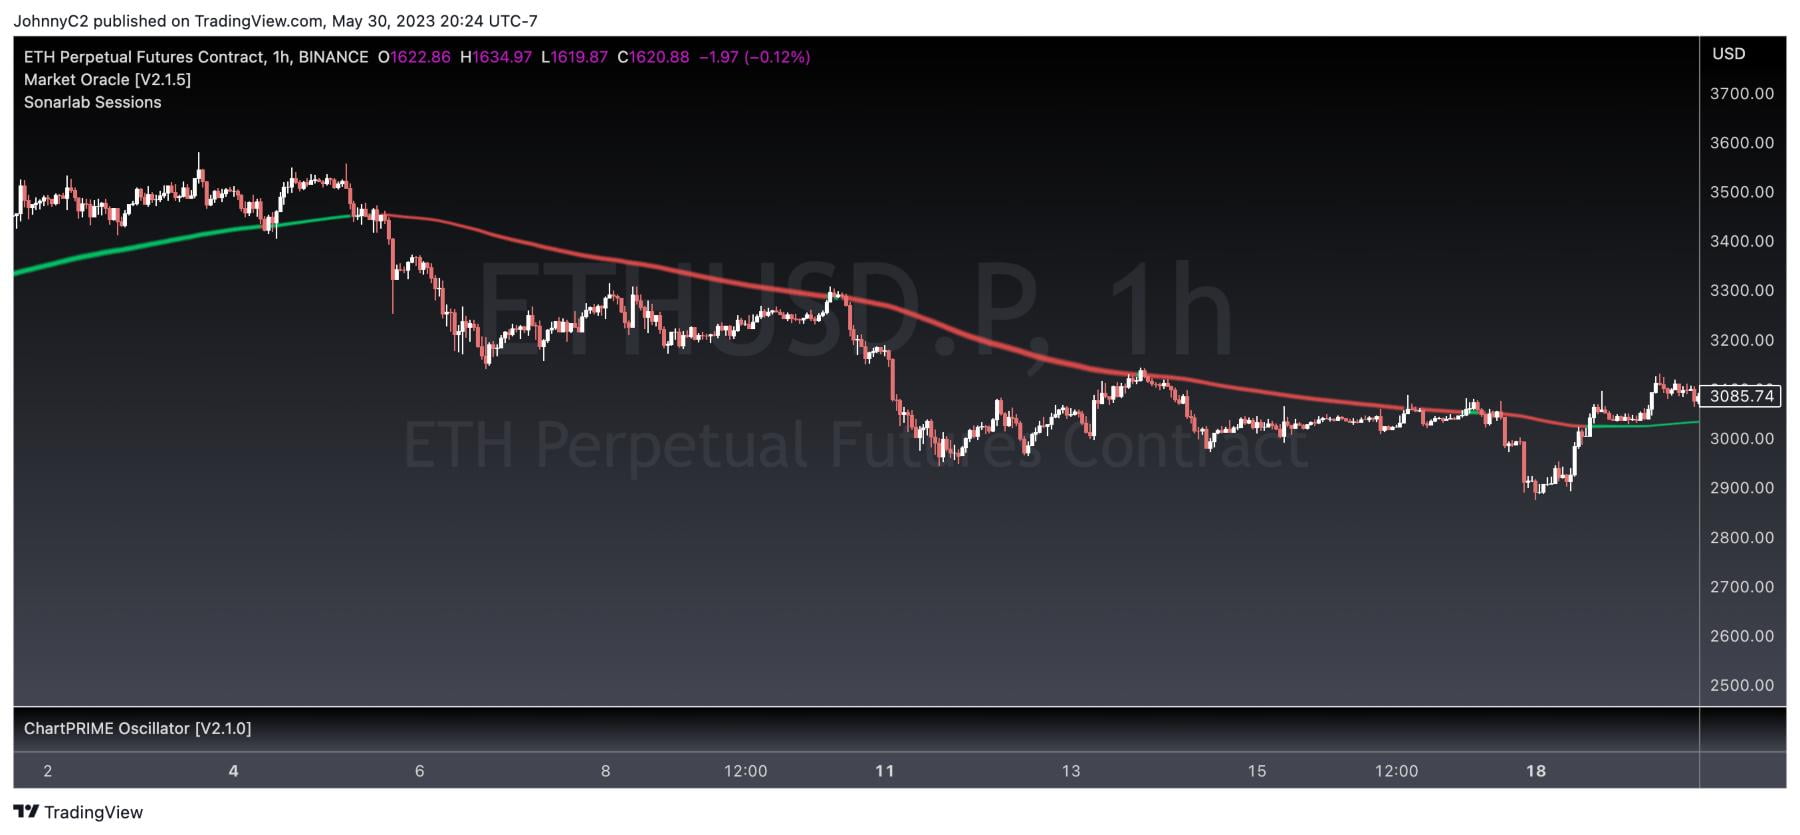
The 200-day moving average is extremely popular in forex and crypto markets. It helps traders identify potential trade entry and exit points or when prices are bearish or bullish. But there is one moving average that is often unheard of: Chart Prime's Dynamic Reactor.
In this article, we'll look in-depth into how Chart Prime's Dynamic Reactor works, why it matters for traders, and what differentiates it from other moving averages. We'll also examine how pro traders use this indicator to determine an edge in their trading strategies.
The Dynamic Reactor is designed to be an additional layer of protection for traders and helps ensure that trades are placed at optimal levels.
It allows traders to determine appropriate entry, exit, by acting as a dynamic support and resistance level.
Furthermore, it also gives traders a better understanding of the overall trend and will enable them to adjust their trading strategies accordingly.
The Dynamic Reactor is easy to use and can be set up in a few minutes. It's also fast and accurate, with a near-instant response time and the ability to detect subtle market changes. This means traders can quickly identify potential entry and exit points or support and resistance points when the price reaches the Dynamic Reactor curve.
Chart Prime's Dynamic Reactor is a powerful tool. It can be an excellent asset for any trader. It's easy to use and fast, allowing traders to make more informed decisions and increase their chances of a successful trade. And because it can be combined with other indicators, such as Chart Prime Oscillator, it provides additional confluence for any trade.
What Is a Moving Average and Why Is It Important?
Confused about how a moving average works? Don't worry; you're not alone! A moving average (MA) is a lagging indicator identifying forex and crypto market trends. They work on all time frames. Traders use an average curve over a certain period, like ten or 30 days, to smooth out price data. This gives traders a clearer picture of the trend.
The most commonly used periods for creating moving averages are the 100, 200 and 50-day moving averages. These particular periods give traders an insight into identifying long-term trends. So why are MAs essential?
Because they provide directional information on the market and potential resistance and support levels. In other words, they help predict short- and long-term prices, making them essential to any forex or crypto trader's toolkit.
Chart Prime’s Dynamic Reactor MA is also a secondary form of support and resistance, but even better.
It combines proprietary Moving Averages with regions of higher volume to create one hybrid technical indicator that gives a more precise analysis of directional price movement.
It helps traders anticipate changes in momentum quicker, thus increasing their chances of profiting from the highest probability trades.
What Are the Best Moving Average Indicators for Forex & Crypto?
Technical analysis is a must-do when understanding the markets and positioning yourself for success. Moving Averages are some of the most popular indicators used by technical analysts and chart readers. They show an average value of price changes over time and are used to generate trading signals.
Among the many types of Moving Averages (MA), there is the Simple Moving Average (SMA) and Weighted Moving Average (WMA). The SMA is a price average over a given period, while the WMA emphasizes recent price activity, making it more robust as a short-term indicator than the SMA.
Chart Prime's moving Average, the Dynamic Reactor, takes these indicators to another level:
- a secondary form of support and resistance
- provides an excellent visual representation of price movements over time
- for crypto and forex swing traders, position and day traders, long term and short-term traders.
- combines volume with a price to better predict where the price is to find support and resistance upon a retrace.
How to Identify the Different Moving Averages
Now that you know the basics of the following specific moving averages, it's time to learn to identify the different types of moving averages. As mentioned earlier, there are four main variants of Moving Averages – Simple (SMA), Exponential (EMA), Smoothed (SMMA), and Linear Weighted (LWMA).
SMA- Simple Moving Average
The Simple Moving Average (SMA) is the most commonly used indicator for Forex and Crypto traders. This type of MA tracks past prices but does not predict future price movements. It is simply an arithmetic average of prices over some timespan.
For example, if you set your Moving Average at ten days, you will track an average of the last ten days' data points based on the close, open, high or low. SMA helps traders identify trends by smoothing out short-term price fluctuations.
By observing the SMA, traders can determine their trades' potential entry and exit points. If the current price is above the SMA line, it indicates a bullish trend; if it is below the SMA line, it means a bearish trend. One of the drawbacks of the SMA is that it can lag behind the current market price, especially during periods of high volatility.
Some traders prefer to use other moving averages, such as the Exponential Moving Average (EMA), which gives more weight to recent price movements. Overall, the SMA is useful for traders, especially those new to technical analysis.
It provides a basic market understanding by identifying trends but should be used with other indicators for more accurate analysis.
EMA - Exponential Moving Average
If you're trying to identify a trend quickly, you might use an Exponential Moving Average (EMA) instead. EMA is a technical analysis tool that smooths out price values by continuously updating the average price based on the most recent price values. Unlike the SMA, the EMA places greater weight on recent price values to better reflect current market conditions.
The formula used to calculate EMA gives greater weight to more recent data points but still considers older ones to determine the average. By using an EMA, traders can more quickly identify trends in the market and better entry points.
The faster the EMA, the more sensitive it is to price changes, which can be helpful for short-term trading. However, it's important to note that using the EMA alone is insufficient for trading decisions. Before executing trades, traders must consider other factors, such as support and resistance levels, momentum, and market sentiment.
SMMA - Smoothed Moving Average
Smoothed Moving Average (SMMA) is similar to EMA in that it attempts to reduce the impact of volatility on market price movements over a certain period. However, SMMAs use two EMAs, a sort of double exponential Moving average, with different periods (shorter and longer windows).
The two EMAs are combined into one indicator, helping reduce noise in the markets while still being able to assess long-term trends.
SMMA is calculated by taking the sum of two EMAs and dividing it by two. The shorter EMA is given more weight in the calculation as it is more responsive to recent price movements, while the longer EMA smooths out the overall trend.
The resulting SMMA line creates a smoother trend line than a single EMA, which can provide a less ambiguous indication of market direction. The SMMA can identify trend reversals and potential buy or sell signals.
When the SMMA moves upwards, it suggests an uptrend, while a downward movement indicates a downtrend. Traders may also look for crossovers between the SMMA and the market price, which can signal a change in momentum and provide a potential entry or exit point.
One potential disadvantage of SMMA is that it can lag behind sudden price movements as the longer EMA takes time to adjust to changes in the market. As with any technical indicator, using the SMMA, other analysis methods and risk management strategies are essential to make informed trading decisions.
LWMA - Linear Weighted Type of Moving Average
Finally, there is the Linearly Weighted Moving Average (LWMA). As its name implies, this variant gives more importance or "weight" to recent data points by calculating all previous closing prices within its fixed period.
The formula of the LWMA is similar to that of the SMA, but the difference lies in how the weight of the moving Average is calculated. In LWMA, the most recent closing prices are given the highest weight, while the oldest ones are given the least, making it one of the best moving averages. The LWMA indicator shows the effect of more recent prices than other moving averages.
However, none of these incorporate volume data as Chart Prime's Dynamic Reactor does, one of the reasons I consider it the best Moving Average Indicator.
Volume is another piece of the puzzle that should be used in all trading markets. Trading without it is like driving without headlights.
The Benefits of Using Moving Average Trading Indicators for Forex & Crypto
Using Moving Average Indicators for Forex & Crypto is beneficial for several reasons. For one, they can provide a more accurate view of market trends and price action.
Long-term traders may prefer to use a more statistically reliable indicator such as EMA. In contrast, day traders may choose a more responsive indicator like LWMA to capture intraday trends better. Moreover, Moving Averages can help traders identify entry and exit points more efficiently.
Finally, Moving Average indicators can be a powerful tool to identify potential support and resistance areas for position, swing trading or day trading.
Chart Prime's Dynamic Reactor trend indicator combines the power of all such moving average hands pulse with the incorporation of volume strength or weakness, making it the perfect tool for any trader looking for a moving average strategy. With its simple visualization of green a red, traders can quickly identify market trends and react quickly to capitalize on them.
A Superior Moving Average Strategy: Chart Prime's Dynamic Reactor
Like other moving averages, the dynamic reactor is designed to be a secondary form of support and resistance and an indicator of trend direction.
The indicator works in real-time and is volume-weighted to provide a more accurate reflection of price movements than standard moving averages.
With its unique combination of the Chart Prime Trading Suite for confluence, it's easy to see why the Dynamic Reactor is often called the Swiss army knife of trading.
How the Dynamic Reactor Enhances Trading Strategies
By Prime's different market conditions, such as volatility and momentum, the Dynamic Reactor adjusts itself to show you the most accurate support and resistance level.
This indicator is excellent for making a profit on market movements and helps traders see potential opportunities they may have missed. The best part is that the Dynamic Reactor considers the fast-paced nature of forex trading and the crypto markets so that it can be used in various strategies. So if you're looking for an advanced form of support and resistance, check out Chart Prime's Dynamic Reactor indicator for forex and crypto trading!

Chart Prime in Tradingview
The Dynamic Reactor, in confluence with other Chartprime indicators, promises traders an edge to get the best result and helps them make profitable decisions.
But did you know that with Chart Prime, you don't even need to switch platforms to try it out? That's because Chart Prime works seamlessly with the TradingView platform, so you don't have to go out don't way to use their tools. Plus, once you sign That's their Premium Trading Suite for just $57/month, you get personalized one-on-one training and features like their advanced charting toolkit for trading success.
By subscribing to Chart Prime's Premium Trading Suite, you can access their advanced charting tools that work with the dynamic reactor and personalized one-on-one coaching sessions. The package includes its Dynamic Reactor indicator and features like automated trade alerts and a customizable dashboard. These features help you make profitable trades and maximize your profits.
On top of that, Chart Prime offers a no-risk money-back 7-day money-back guarantee. This means that if you're not satisfied with the results of their services, you'll get a full refund.
That's Chart Prime's confidence in its services and its Dynamic Reactor indicator. So if you want to succeed in forex and crypto trading, you should try Chart Prime. You won't regret it.
Conclusion
By understanding the behaviour and tendencies of the Dynamic Reactor, investors can reap the benefits of this powerful yet simple moving average indicator.
When utilized correctly, the Dynamic Reactor can be a great addition to anyone's trading arsenal. This indicator is just one of the many innovative products Chart Prime offers in the trading suite, so be sure to check anyone's rest in their products and see how they can benefit your trading strategies.
Chart Prime has an extensive library of tools and services to make trading easier. Their innovative products are designed for beginners, pros, and everyone. Chart Prime has all the tools to help you get the most out of your trading experience, including a strong Discord Community.
Chart Prime has the ideal platform to meet your needs, whether you're a seasoned trader or just getting started. Their user-friendly interface makes it easy to access the tools and resources you need to make the most of the markets. Plus, with the help of their support team and fellow traders on Discord, you'll be able to troubleshoot any issues you may have encountered and get back on track.
So if you're looking for an advanced moving average indicator like the Dynamic Reactor and community support with weekly live tutorials, turn to Chart Prime. Their innovative products and services have helped countless traders get the most out of their trading experience, and they can do the same for you!
FAQ
Q: What is a moving average indicator?
A: A moving average indicator is a calculation that is used to identify trends and support and resistance levels in financial markets. It is based on the average price over a specific time period and can be used to help traders determine when to enter or exit a trade.
Q: What are popular moving averages used for trading?
A: Popular moving averages that are used in trading include the simple moving average (SMA), exponential moving average (EMA), and the weighted moving average (WMA).
Q: What are the benefits of using a moving average indicator?
A: Moving averages can be used to identify trends, determine support and resistance levels, and help traders make better decisions about when to buy or sell assets.
Q: What is the difference between SMA and EMA?
A: The SMA calculates the average price of an asset over a specific time period, while the EMA gives more weight to more recent prices, making it more responsive to changes in market conditions.
Q: Can moving averages be used for both swing trading and day trading?
A: Yes, moving averages can be used for both swing trading and day trading, but it depends on your trading style and time frames.
Q: How can I use two moving averages in trading?
A: One popular strategy for using two moving averages is the moving average crossover, where a short-term moving average crosses above or below a longer-term moving average.
Q: What is the moving average convergence divergence (MACD) indicator?
A: The MACD is a popular trading indicator that is based on moving averages to identify changes in momentum and trend direction.
Q: What other types of moving averages can be used for trading?
A: Other types of moving averages that traders can use include the adaptive moving average, triple exponential moving average, hull moving average, triangular moving average, and of course, Chartprime's proprietary moving average the dynamic reactor.
Q: How do I use moving averages to identify support and resistance levels?
A: Traders can use moving averages to identify areas of support and resistance by looking for where the price interacts with the moving average. If the price bounces off the moving average several times, it can be a good indicator of support or resistance.
Q: Do popular moving averages work for live trading?
A: Yes, popular moving averages can be used effectively in live trading as long as traders understand how to use them in their trading strategies.