The Stochastic Oscillator and its variant, the Stochastic Divergence indicator, are indispensable tools for traders hoping to take advantage of market movements. Utilizing the closing price's relationship to its range over a pre-determined period of time – usually, fourteen – the Stochastic Oscillator identifies when markets are overbought or oversold.
IMPORTANT
As for the best stochastic divergence indicator for mt4 and download, it looks for potential trend reversals by comparing the indicator to the instrument's price direction.
When these directions flow in opposite directions, a divergence appears, potentially indicating a trend turnaround.
Having an easy-to-interpret set-up and being compatible with MetaTrader 4 make this technical analysis indicator a must-have asset for clever traders. Yet, one should not rely solely on the indicator; instead, include other analyses and indicators in your strategies. Additionally, confirm any divergences through various timeframes and chart patterns before making trades based on this tool. This is to get the bigger picture when trading.
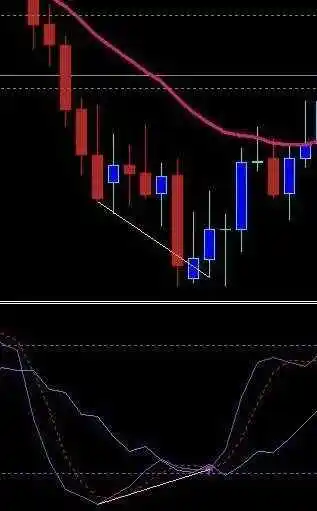
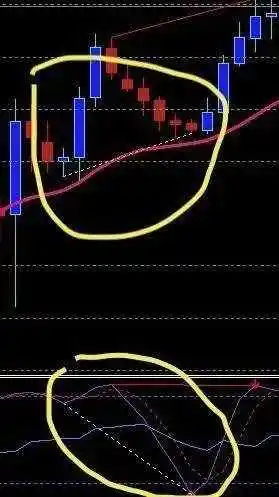
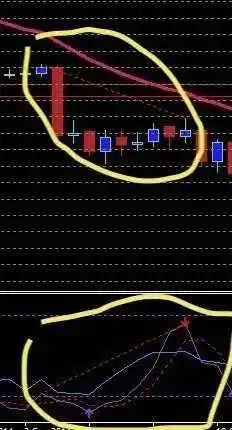
In the above picture, we see regular divergence, where the price continues in one way, and the stochastic diverges in the opposite direction.
STOCHASTICS OSCILLATOR & THE BEST STOCHASTIC DIVERGENCE INDICATOR FOR MT4 and DOWNLOAD
The best stochastic divergence indicator for mt4 and download is the go-to tool for traders searching for an edge in trading. This cutting-edge momentum indicator compares an instrument's closing price to its range throughout a certain period of time and is illustrated by a fluctuating line which moves between 0 and 100. When the oscillator dips below 20, it signals that the market is oversold, and when it rises above 80, then the market is deemed to be overbought.
When implemented in tandem with other technical indicators such as resistance levels, support zones, and chart patterns, savvy traders can use the Stochastic oscillator to their advantage, determining the most beneficial times to enter and exit the market.
By considering this indicator's data, they can buy when it is moving towards or under the 20 region and sell when approaching or surpassing 80, towards the extreme range.
It should also be noted that the stochastics indicator follows the speed and energy of price, rather than the actual cost. To ensure success, traders should combine this insight with support and resistance, various trends, chart figures, and other indicators to make calculated trading decisions over time.
OVERSOLD/OVERBOUGHT
The best stochastic divergence indicator for mt4 and download is an essential tool for technical analysis traders as it can identify areas of potential trend reversals and calculate optimum entry and exit points.
Represented by a line that oscillates between 0 and 100, when the oscillator falls below 20 the market is said to be oversold, while if the oscillator reaches above 80, the market is known to have become overbought. I
t's wise to rely on more than just this indicator when entering into any trade; use price action, chart patterns, support/resistance levels and other indicators such as RSI Divergence to confirm your decisions.
While you can use the Stochastics indicator to observe momentum and make some profitable moves, don't apply technical analysis without also considering long and short-term fundamentals or volume analysis, lest you risk being caught off-guard later down the line.
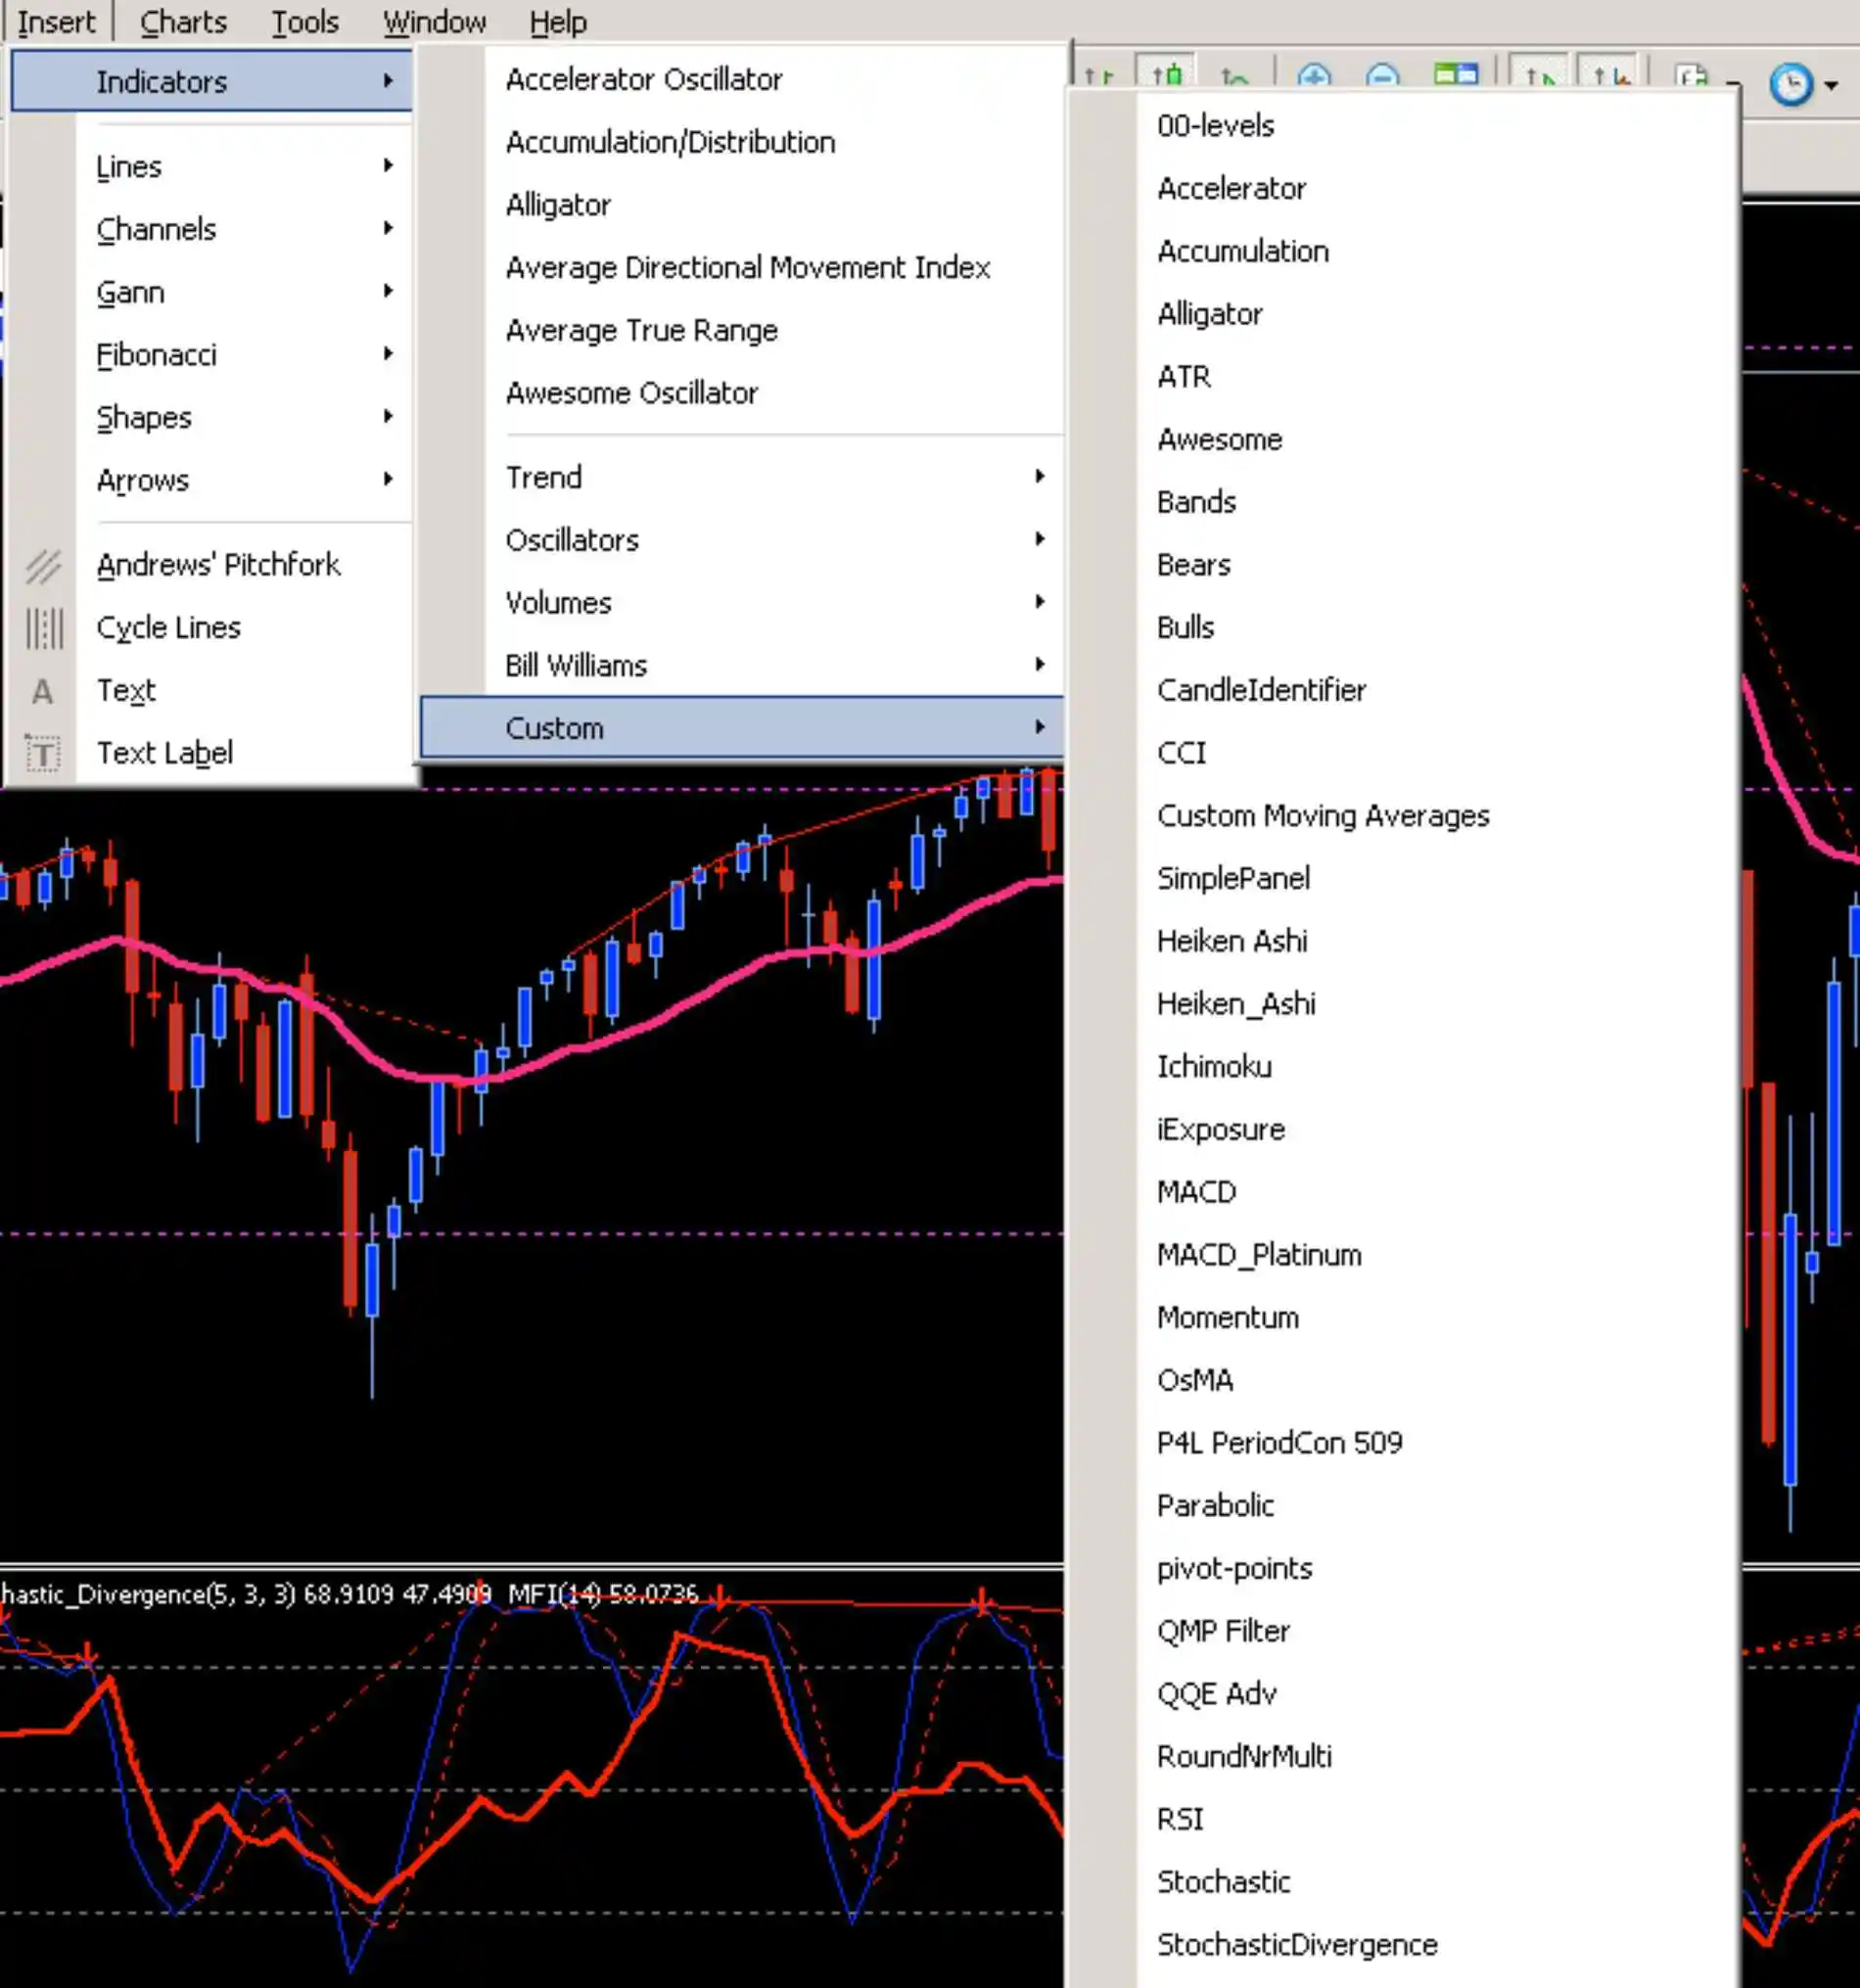
Find the Custom Indicators file in the Navigator button and right-click on the Stochastic divergence indicator label.
IMPORTANT
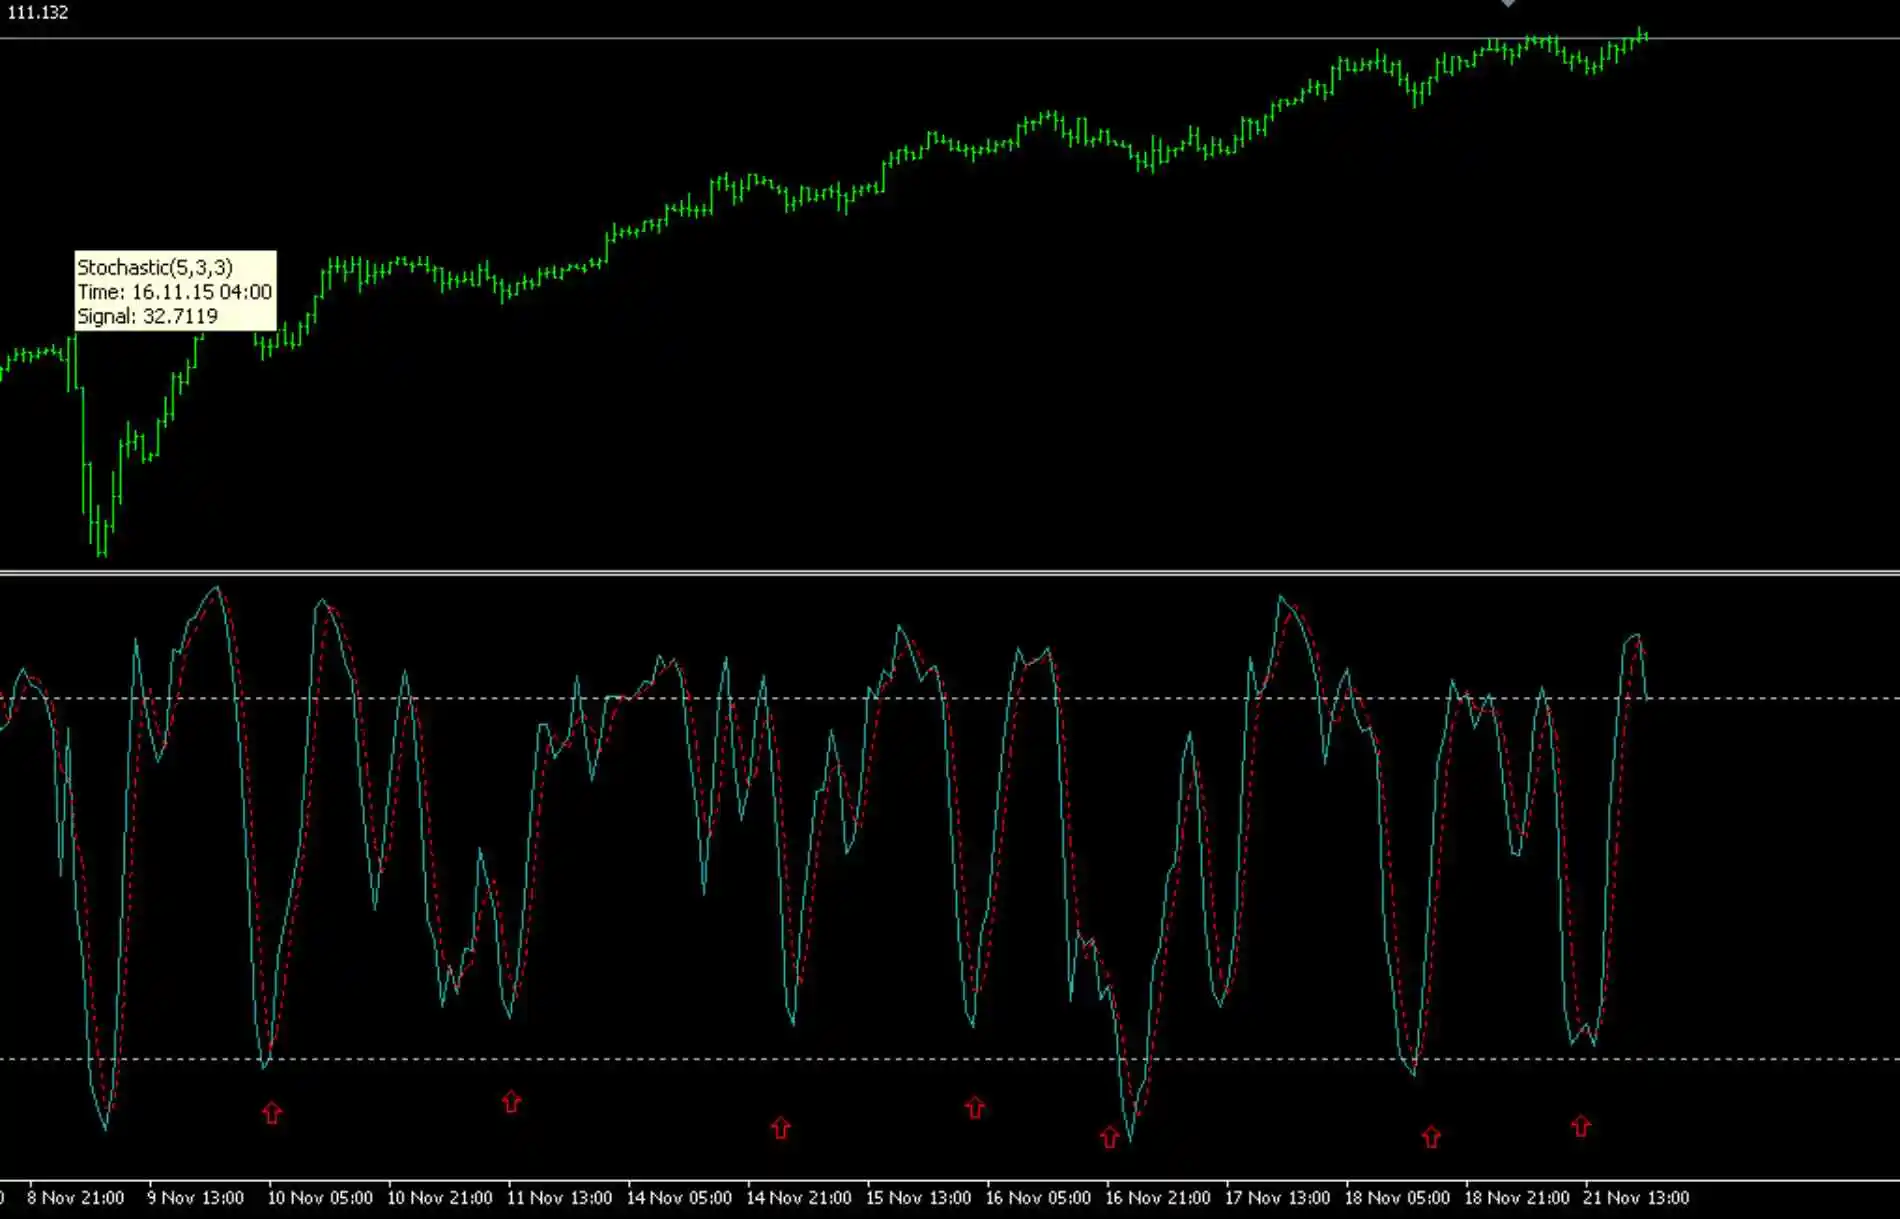
The following is a picture of the USD/JPY pair and its upward climb. Note the areas of oversold as good regions to enter the trade as a buy.
This trade entry direction was based on the post-election surge in risk-on sentiment, with large amounts flowing into the USD.
This risk-on sentiment resulted from a realization at the time of Trump’s plan to invest in
US infrastructure which the markets concluded would result in inflation and the FED raising their rates.
The red arrows indicate the buy points where one could enter, given the extreme bullishness for the reasons just mentioned. I made money off of this but, unfortunately, didn’t plan a proper exit. I could have made substantially more if I had understood the effect of news in the long term. Lesson learned.
Fundamentals and Sentiment could help plan both entries and exits, along with oversold and overbought conditions. In addition to overbought and oversold conditions, we will add the condition of regular and hidden stochastics divergence for MT4 trading platforms.
IMPORTANT
Again, a typical technical analysis entry is based on a confluence of factors, most notably the underlying sentiment mentioned above.
Along with the sentiment, the other factors typically needed for confluence are: support/resistance, the direction of moving averages, bouncing off of moving averages, certain candlestick patterns, etc.
Stochastics are only useful when taken as adding certainty to trade along with the other confluence factors mentioned above. The two types of stochastic divergences mentioned below are even more potent in combination with the other confluence factors for a trend continuation or reversal.
Regular stochastics Divergence will be used for trend reversal, and Hidden stochastics Divergence will be used for a trend continuation. In addition to entering a trade, Stochastic Divergence on MT4 indicators can be used for exiting a trade. How long should one stay in the trade? If it’s a strong sentiment like the one mentioned above, then as long as it’s still in the news. In regards to the chart above, news articles mentioned this sentiment trend for days after the election.
The stochastics indicator could be used with the news to arrive at a realistic exit. An overbought condition or regular divergence may be valid for an exit for a long trade or not, depending on how strong the news is that causes a price movement in the first place.
I use the 5, 3, 3 exponential settings for the stochastics Divergence Indicator for MT4 in the following examples. The indicator will be downloadable below. I'll try to find an MT5 indicator written in MQL5 for download, but the same parameters work in all cases.
REGULAR DIVERGENCES
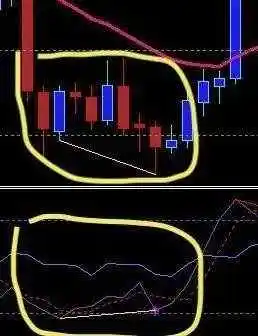
A regular divergence is used as a possible sign of a trend reversal. I use it as trend continuation as well. If the price is making lower lows but the oscillator is making higher lows, this is called regular bullish divergence. After forming a second bottom, the price will likely rise if the oscillator fails to make a new low, as price and momentum are normally expected to move in line with each other.
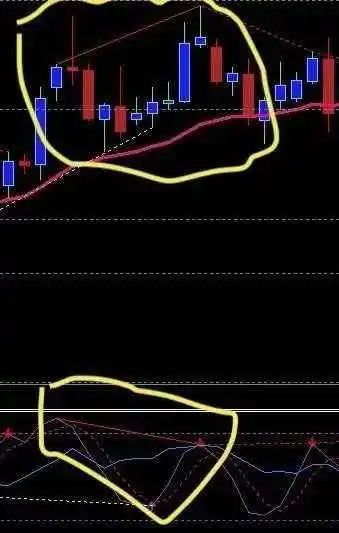
If the price is making a higher high, but the stochastics oscillator is a lower high, then it’s referred to as regular bearish divergence. After the price makes that second high, if the stochastic divergence indicator for MT4 makes a lower high, the price may reverse and drop.
If the price is making a higher high but the oscillator is a lower high, then it’s referred to as regular bearish divergence. After price makes that second high, if the stochastic divergence indicator for MT4 makes a lower high, then the price may reverse and drop.
HIDDEN DIVERGENCE
Hidden divergence is used as a possible sign for a trend continuation. If the price is in a general uptrend and the price is making higher lows but the oscillator is making lower lows, this is called hidden bullish divergence. After forming a second bottom, if the oscillator make a new low, it is likely that the price will continue to rise, as price and momentum are normally expected to move in line with each other
If the price is in a general downtrend and the price is making a lower high but the oscillator is a higher high, then it’s referred to as hidden bearish divergence. After price makes that second high, if the oscillator makes a higher high, then the price may reverse and drop.
CONCLUSION
Installing the Stochastic Divergence Indicator for MT4
Download
Download the Stochastic Divergence indicator after signing up below
Subscribe below to our newsletter below to receive regular updates and get instant access to our free Stochastic Divergence Indicator.
FAQ
A: This technical indicator compares a financial asset's closing price to its range in a specific timeframe, and is charted as an oscillating line from 0 - 100. Reaching levels below 20 warns investors that the market may be oversold, while values above 80 highlight when the market is possibly overbought!
A: The Stochastic Divergence indicator for MT4 is a sophisticated tool designed to detect possible trend reversals by comparing the indicator with the price movements of the instrument. By looking for the disparity between these two, a divergence appears, signalling that a potential change in the trend direction may be coming. Unlock the power of the Stochastic Divergence indicator and stay ahead of the curve!
A: The Stochastic Divergence indicator for MT4 is a sophisticated tool designed to detect possible trend reversals by comparing the indicator with the price movements of the instrument. By looking for the disparity between these two, a divergence appears, signalling that a potential change in the trend direction may be coming. Unlock the power of the Stochastic Divergence indicator and stay ahead of the curve!
A: The Stochastic Divergence indicator for MT4 is a powerful asset for traders seeking to refine their strategies. Easy to interpret and compatible with MetaTrader 4, it can help traders identify potential trend reversals and make more informed decisions by providing an additional layer of technical analysis. Forego complacency and capitalize on the opportunity with the versatility of the Stochastic Divergence indicator!
A: Confiding in the Stochastic Divergence indicator as your sole source of insight for making trades is not recommended. Rather, it is essential to weave other analysis and indicators into your trading strategies, creating an overall picture before engaging in any trades that are informed by this powerful tool. To further ensure accuracy, compare divergence readings from different timeframes and spot potential chart patterns — only then can you make a confident decision.
A: By utilizing the Stochastic Divergence indicator in combination with other confirmatory elements like support and resistance levels, moving averages, candlestick patterns, and market sentiment, you can identify effective entry and exit points for your trades. Unleash the power of Stochastic Divergence and start making profits today!




Well, I don’t understand too much of diagrams and details so I was looking for a good source since I saw your post. I think it helped me a lot. I will recommend others read this post. Nowadays we need to have enough knowledge about graphical data analysis so, thanks a lot for sharing this post.
Many, many thanks for the really helpful and informative information you provided on the stochastic divergence indicator. Regarding these matters, I do not have a lot of knowledge. However, I am currently educating myself about the stock market. I have a feeling that the information contained in this essay will be very useful to me in the years to come. This is going straight into my bookmarks. Continue to post in the same manner.
I hope you don’t turn down my comment. You can edit this how you would like, but it is really over my head and I don’t quite understand what a Stochastic Divergence Indicator for MT4 is used for. From what I read, I am thinking it has something to do with the stock market and how things are over produced or marketed. Is this correct? Who would use this? Businesses or people who use the stock market?
Thank you so much! I am right now installing the Stochastic Divergence Indicator for MT4
I would also love to get instant access to your free Stochastic Divergence Indicator. Thanks for the great possibility and offers! I would also like to know whether through this link my brother-in-law can sign up as well?
Regarding the best stochastic divergence indicator for mt4 and download, I have been trying to distinguish hidden bullish divergence. This can be seen when the pair is in an uptrend. Once price makes a higher low I look and see if the oscillator does the same. If it doesn’t and makes a lower low, then I got some hidden divergence. But I still haven’t gotten good at spotting them.
Hi,
Regarding the best stochastic divergence indicator for mt4 and download, I have installed then MT4 is opened. But is it active in my chart, pls advise how can i ensure it and in indicators list in which name i can find.
Also pls advise once installed does it show earlier divergence. Kindly clarify the above thanks.
Regards,
Premkumar
Once installed go to insert, indicators, custom as shown in the picture near the bottom of this article. Then scroll down to stochastic divergence.
It should show up at the bottom of your chart and yes it shows earlier divergence.
Reading your article gives me memories of the first time i decided to engage forex trading without proper knowledge. i suffered great loss.
it is possible to use more than two indicators but they do not always align. how do we know which is best? is there a limit to the number indicators that we can combine with the stochastic?
The Stochastic Oscillator Technical Indicator shows where a currency pair’s price closed concerning its ranging price over a fixed amount of time. From this, you can get an idea of when the price is oversold or overbought or diverging from the price itself. These can be turning points or points of price reversal from a primary trend or correction.
Having said this, don’t use too many indicators. I only use two and no longer even pay attention to a moving average. Support and resistance, price action, candlestick patterns, and fundamental analysis plus sentiment are kings.
I use the stochastic indicator to fine-tune my entries. They are the least important in my decision making.
Stochastic divergence is a Metatrader 4 (MT4) indicator and the essence of the forex indicator is to transform the accumulated history data. Stochastic divergence provides for an opportunity to detect various peculiarities and
patterns in price dynamics that cannot be spotted by the naked eye.i have been using it for a very long time now and i must tell you its the best.
Yes, as I mentioned, I use it for either regular divergence or hidden divergence in the case of a trend continuation. There are similar formations for the MACD indicator, RSI indicator, or OBV indicator. I use the stochastic divergence indicator in the form of regular divergence to indicate overbought and oversold conditions as well at major support and resistance levels.
Nice, the best is always the best. But why only 4 and a half stars if it is the best? Do you read your charts with japanese candle sticks? Would you recommend using japanese candlesticks for long term trading, like 10 to 20 years?
I am curious to know what kind of trader you are… and aside from MT4, which forex trading platform gives the best advise?
Yes, I used Japanese candlesticks even for longterm trading. I using a Tradingview as well as MT4 but find the divergence stochastic indicator is better on MT4. With the divergence stochastic indicator on MT4 I can easily :
-recognize regular and hidden divergences between the price and the indicator.
-use it with trading strategies for trend reversal and trend continuation.
– use it with expert advisors.
– use it to time entries and exits.
– set up alerts if needed for hidden, regular divergence and overbought/oversold conditions
hello there,Stochastic divergence indicator for meta trader 4 is a really good one…although I am not using meta trader 4 yet I would to download it…indicators are very important when it comes to trading forex as they help you take advantage of every trade you want to make….thanks for sharing…
You can check out the Mql5 marketplace if you’re trading with MT5. They may have the stochastic divergence indicator for MT5 there. You don’t want to spread yourself too thin with the number of trades that you take. The Stochastic Divergence indicator for MT4 will help you fine-tune your trades to those that are of higher probability.
You need to rely on support and resistance zone as well as the overall direction of the upper and lower time frames. Even then you may not be ready to place a trade, certainly not with the stochastic divergence indicator alone.
Test all this out using playback on Trading View. There you’ll find divergence forex indicators.
This would definitely take me a while to get used to, but from what I’m seeing here it looks as if it shows the trend of stock prices at a given time in the market – correct me if I’m wrong. If this is the case, I’d be interested in further looking into a product like the divergence indicator, since I’ve very recently (literally last week) have gotten involved in stock trading – trying to take advantage of this perpetual downswing we’ve been in. Anyway, I’m interested in the download but I definitely want to be on point that this is geared toward stock trading. Thank you for your help.
This is a stochastic divergence indicator for MT4, which means it’s geared towards forex, not stocks. However, you can find a similar product on trading view at tradingview.com premium, which can be used for stocks. It doesn’t show the trend of stock; it shows areas of pullback or reversal. The regular divergence is used for a trend reversal, and the hidden divergence is used for pullback and continuation.
Thanks for breaking down how the Stochastic Divergence Indicator for MT4 works. I have asked several questions about this device, but now I know it will analyze and do a proper evaluation of the overbought and oversold areas. I believe staying abreast of the news alongside the indicator will guarantee a high percentage of my success.
Once again, thanks a lot
Most of the indicators work similarly, whether it be the rsi divergence indicator, macd divergence indicator, cci divergence indicator, or other. What’s critical is areas that are overbought and oversold. These areas should be combined with areas of support and resistance for consistent results. The present news is not sufficient for your arsenal of information.
You must be aware of previous news, and market expectations fo the currency. An excellent place to start is Ransquawk news. They offer commentaries to present market conditions for each currency.
This is fascinating information on an indicator for trades. I agree that it should be used with other characteristics in the process of trading.
I also agree that we should not just rely on technical signals. I appreciate you sharing this information. I am still learning how to trade and this information is very helpful.
This divergence strategy is new to me but I will look forward to learning this. The demo account is very helpful. All the Best to your continued success.
The stochastic divergence indicator is insufficient by itself to base trades off of. Combine this with key levels and the news I mentioned and your trading will be better as a result.
While I have done stocks and EFT (Exchange-traded fund) trading, I never done forex trading. It’s very interesting for any investor to try this forex trading. Your education section definitely good for every newbie like me to find out more and learn how to forex trading online works. The demo account also will be helpful for someone to get life experience before we switch to real trading the transactions. I’ll definitely will sign up and try it.
Remember the free hidden divergence indicator / regular divergence indicator is available below. This stochastic divergence indicator operates a lot like other indicators such as the rsi divergence indicator, macd divergence indicator, and even the OBV divergence indicator. They work the same as they do on stocks. So, if you’ve used any of these in your stock trading you’ll be familiar with them already.
Yes, use the indicator on a demo account first and don’t forget to combine it with other confluences.
i ventured into making money online by using binary option. one major challlenge was been able to predict the outcome of sales, rising stocks and the stable profit making products. getting the best indicators is the key to success and your review has done a great job here. you have been able to point out the best stochastic divergence indicators
It’s one of several stochastic indicators you can choose from. These help me decide when a currency or cryptocurrency is oversold or overbought. It’s one of many indicators that you can use to do this. For the stochastic divergence indicator free download, see above.
When I saw this article it excited me. I trade Forex almost daily. I do use the Stochastics in conjunction with the HMA and trend lines to confirm a trade. There is one type of trader who will only enter a trade at a turning point to take advantage of maximum profit. Another type of trader looks for clues to enter into a trend while it is in progress. Regardless what one does I feel it is critical to have a system where the winners, no matter if they are followed by a string of losers is big enough to provide a net profit.
Just like you experienced news can ruin a trade. I have been beaten up trading the GBP pairs with the news taking the GBP in sharp reversals that kept taking me out. Fortunately I used small lot sizes so I am still in the game.
I am a funded member of the Apiary Fund where I trade their money. Since they manage our risk if we screw up we have to use their trading chart system called Alveo. You should check out what they do.
Thanks for sharing this trading divergence strategy. I wish you much success in your trading.
Edwin
I also have articles on managing trades. See the following:
https://andiamolireforex.com/forex-risk-management-example/
https://andiamolireforex.com/forex-and-money-management/
Though I am an active trader and I do that almost everytime, stochastic oscillator has never been a big turn on to me and for this reason, I have never given it much consideration. Though I know it is a very effective tool but then, I haven’t had any success with learning the use. Thumbs up to you for sharing this
This stochastic indicator is a very helpful mt4 indicator download. I consider it a trend indicator in the MT4 platform because it helps to find lower-risk entry points. I would not use it alone. Use it in conjunction with fundamental research and candlestick patterns:
https://andiamolireforex.com/forex-trade-research/
https://andiamolireforex.com/best-day-trading-strategies-using-price-action-patterns-pdf/
Very interesting! Thank you for sharing, I have been dabbling in stocks for a couple years now, and still not quite getting the hang of it. Your charts explain things very nicely, easy to see that way. What kind of volume should I be looking for? The technical aspect seems simple enough, but obviously that is not enough to turn a profit. Stocks can be so confusing!
The MT4 indicator download I provided you with is not going to do you much good if you’re not using the MT4 forex platform. If you can find a similar script for your stock chart platform, then it’s well worth getting.
I’m sure the same techniques would apply with stocks as they do with forex. Try studying some of the larger stocks to see how they move with respect to news and longer-term fundamentals.
Renko EA for MT4
Wow! This could be one particular of the most beneficial blogs We have ever arrive across on this subject. Actually Fantastic. I’m also a specialist in this topic so I can understand your hard work.